Carlos Sainz Jnr has repeated his call for Formula 1 to change its qualifying format for the Monaco Grand Prix.
The Williams driver wants the world championship to adopt the same special qualifying format used by its support categories Formula 2 and Formula 3 at the Monaco circuit.
Sainz says congestion is a serious problem when F1’s full field is on the track, as happens in the first round of qualifying.
“With 20 cars on-track, we’re trying to get to do some clean laps without traffic running in different times compared to the others,” he said yesterday. “But as soon as there’s 15, 18 cars on the track, it becomes a bit of a nightmare. Typical Monaco.”
In the Formula 2 and Formula 3 support events, the field is split into two and each has a separate qualifying session. The grid is decided by awarding pole position to whichever driver sets the quickest time in each session.
“I hope one day we get the group qualifying here because it would simplify everything so much and make everyone’s life a lot easier,” said Sainz.
The split qualifying format has been used for years in F1’s support races in Monaco. These tend to have much larger grids than F1: There are 22 cars in F2 and 30 in F3. The drivers’ relative inexperience has also been cited as a reason for reducing the number of cars on-track during qualifying.
However splitting the field into two parts inevitably raises concerns that one might benefit from better track conditions than the other. At all circuits, grip levels tend to improve the more cars run, as the surface becomes cleaner and more rubber is laid down.
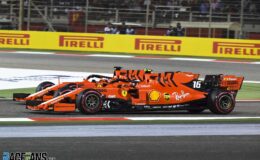
Sainz missed a potential pole in 2014 due to group qualifying
The effect is particularly strong in Monaco because the temporary track surface is very low in grip to begin with. Therefore, in theory, drivers who run in the second session later in the day should benefit from better conditions.
Is this the case? Data from 30 single-seater support rounds held in Monaco over the past 20 years suggests so. On 21 occasions, pole position went to the driver who set the fastest time in the second session.
On some occasions, this was due to severe changes in conditions. For example the qualifying sessions in 2008 for Formula Renault 3.5 (a Formula 2-level series) and in 2015 for GP2 (later rebranded as Formula 2) meant the unlucky drivers drawn in the first group knew they had no realistic chance of taking pole position.
However the beneficial effect of running in the second group may have lessened over time. This could be because the track has been resurfaced or is being prepared to a more consistently high standard, meaning drivers gain less time as it rubbers-in and cleans up from session to session.
If F1 did introduce this format, it should brace itself for complaints. Imagine the potential for controversy should a championship contender be drawn in the ‘slower’ qualifying group, particularly in a rain-affected session.
IndyCar’s approach to qualifying on road and street courses could offer a useful compromise. It runs two separate group stages, then combines the top drivers from each field for a further two stages to decide the front end of its grid.
Sainz himself has been the ‘victim’ of the slower session once, when he lost pole for the Formula Renault 3.5 race in 2014 to Norman Nato. However he clearly believes the format has merit. He previously said it is “too dangerous” for all 20 F1 cars to qualify together on the principality’s tight street circuit.
The debate is unlikely to go away, particularly as F1’s grid will grow to 22 cars next year.